
Home › Weekly report › Nov 13
Calf prices mixed across Panhandle barns; drought eases in 11 counties
Built Nov 13, 2026 from data through Nov 13. Re-running for this date gives the same numbers.
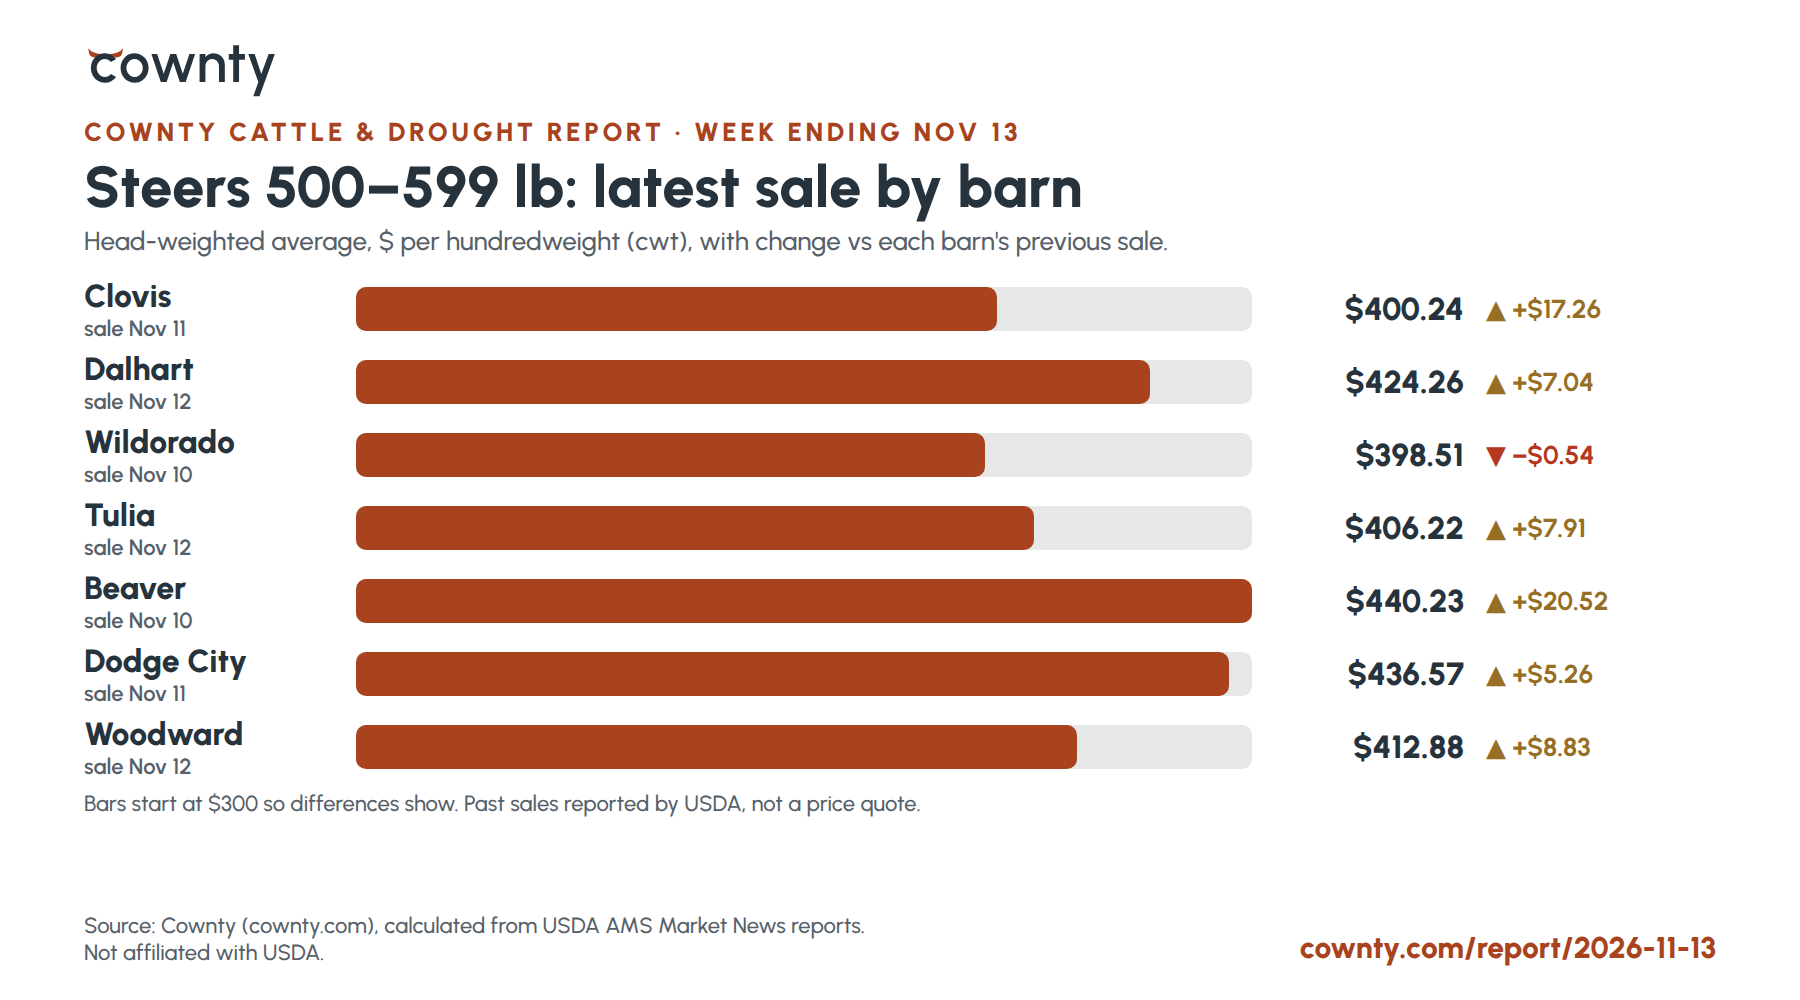
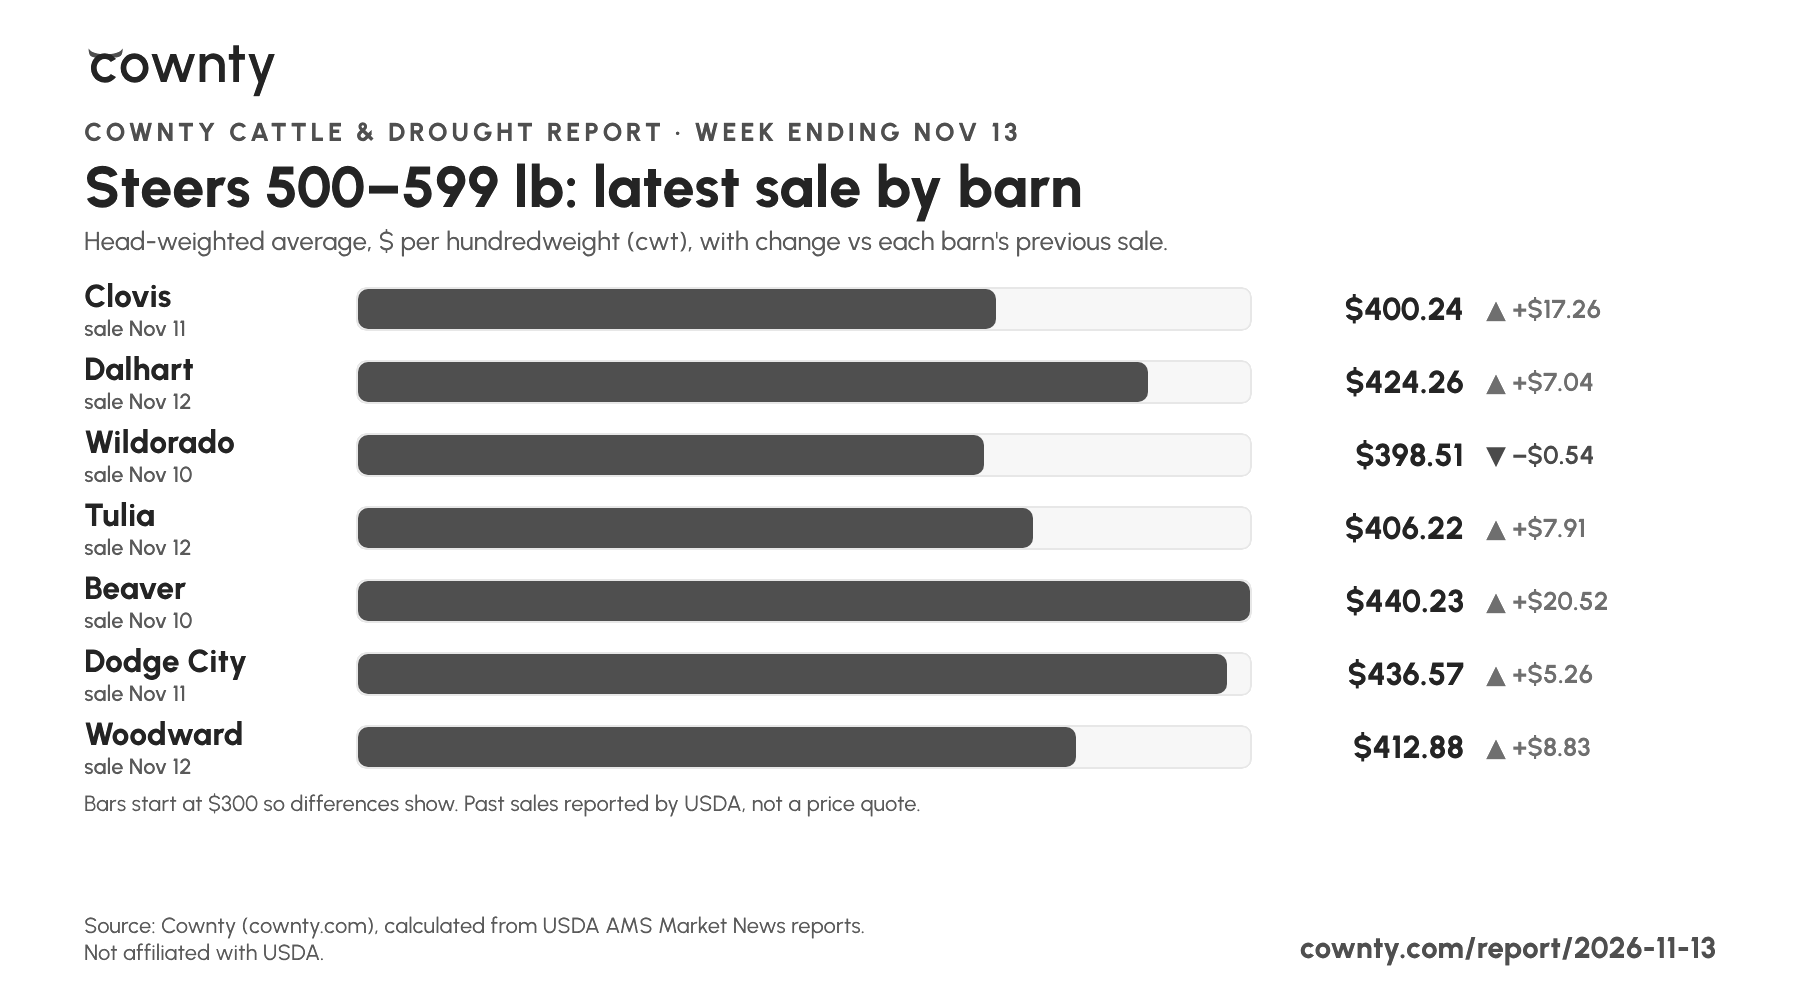
Steer calves weighing 500–599 lb averaged $398.51 to $440.23 per hundredweight across seven USDA-reported area sales held Nov 10–12, a spread of $41.72; the top average was at Beaver. Compared with each barn's previous sale, the 5-weight steer average was higher at 6 barns and lower at 1. The seven sales reported 18,292 head in total.
USDA's market reporter at Dalhart noted: "Calves and feeders gained back what they lost last week, maybe even gaining some. Though there were few comparable sales, almost all classes of steers and heifers made gains."
On the U.S. Drought Monitor map dated Nov 10, 21 of the region's 49 counties had some severe drought (D2) or worse, and 12 had it across most of the county. Severe-or-worse coverage shrank by at least 5 points in 11 counties, including Lipscomb (TX), Hutchinson (TX), Roberts (TX), Hemphill (TX) and 7 more, and grew that much in none.
All 49 region counties are on FSA's 2026 Livestock Forage Disaster Program list. Applications for 2026 losses are due March 1, 2027; FSA decides each operation's eligibility.
The nearest active New World screwworm zone in Texas (TAHC) is roughly 187 miles from Amarillo in a straight line. Animals leaving an infested zone need TAHC inspection and treatment.
Barns in a fixed order (west to east), not ranked. Bars start at $300 so differences show. Head-weighted USDA averages.
| Area | Counties | Any D2+ | Most D2+ | On 2026 LFP list |
|---|---|---|---|---|
| Texas Panhandle | 26 | 12 | 6 | 26 |
| Oklahoma Panhandle | 3 | 0 | 0 | 3 |
| Western Oklahoma | 5 | 5 | 4 | 5 |
| Southwest Kansas | 10 | 1 | 0 | 10 |
| Northeast New Mexico | 2 | 2 | 2 | 2 |
| Eastern New Mexico | 3 | 1 | 0 | 3 |
| Barn | Sale | Steers 500–599 | vs last sale | Steers 700–799 | Heifers 500–599 | Receipts |
|---|---|---|---|---|---|---|
| Wildorado | Nov 10 | $398.51 | −$0.54 | $326.86 | $353.43 | 710 |
| Dalhart | Nov 12 | $424.26 | +$7.04 | $344.13 | $362.07 | 2,286 |
| Tulia | Nov 12 | $406.22 | +$7.91 | $306.90 | $352.44 | 944 |
| Woodward | Nov 12 | $412.88 | +$8.83 | $341.08 | $354.01 | 1,577 |
| Beaver | Nov 10 | $440.23 | +$20.52 | $345.32 | $358.72 | 5,954 |
| Clovis | Nov 11 | $400.24 | +$17.26 | $325.39 | $366.08 | 2,354 |
| Dodge City | Nov 11 | $436.57 | +$5.26 | $351.83 | $374.60 | 4,467 |
| OKC benchmark | Nov 9 | $420.08 | +$5.97 | $335.55 | $356.22 | 5,500 |
| Joplin benchmark | Nov 9 | $386.08 | −$1.66 | $333.96 | $342.14 | 5,000 |
$425.67/cwt +$13.59 vs last week · 7 barns, 1,383 head
"This is your Cownty cattle and drought report. Prices are past sales, not a quote. Five-weight steer calves brought about 399 to 440 dollars a hundred this week, topping out at Beaver, higher than the last sale at 6 of seven area barns. The Cownty five-weight index, all seven barns averaged by head, came in at 426 dollars a hundred, up 14 dollars from last week. On the drought map, severe drought eased in 11 of our 49 counties and grew in none. All 49 of our counties are on this year's Livestock Forage Disaster Program list, and applications are due March first at your county FSA office. Texas's nearest New World screwworm zone is about 187 miles from Amarillo. Barn-by-barn prices and county drought maps are free at cownty dot com."
Source: Cownty (cownty.com), from USDA AMS Market News and the U.S. Drought Monitor. Prices are head-weighted averages of USDA-reported lots ($/cwt), past sales, not quotes. Information only; FSA decides eligibility. Not affiliated with USDA. Barns: Wildorado, Dalhart, Tulia, Woodward, Beaver, Clovis, Dodge City, OKC, Joplin (USDA AMS report ids on each barn page). Drought: U.S. Drought Monitor. LFP: FSA eligible-county file dated Nov 5, 2026. Screwworm zones: TAHC.
Download and reuse
PDF (letter) Plain text Paper edition (6 and 10 inch) Radio script All facts (JSON)
For editors, print charts (1800×1000, 300 dpi, local barns west to east with sale date and change): Color chart (PNG) · Grayscale chart for newsprint (PNG)
Free to reprint with the credit line "Source: Cownty (cownty.com), from USDA data." Prices are past sales, not quotes.
How this report is made
Every sentence is built from a number computed from the USDA reports and maps listed above; nothing is written freehand. A barn is named in the story only for the top average or a favorable fact. The report covers sales from Saturday through Friday and the Drought Monitor map dated that week's Tuesday. It is held, not published, when any barn moves more than 25% from its last sale, fewer than 4 local barns report, the drought map is not this week's, or the county table is incomplete. How the 5-wt Index is figured.